01Every purchase has a context
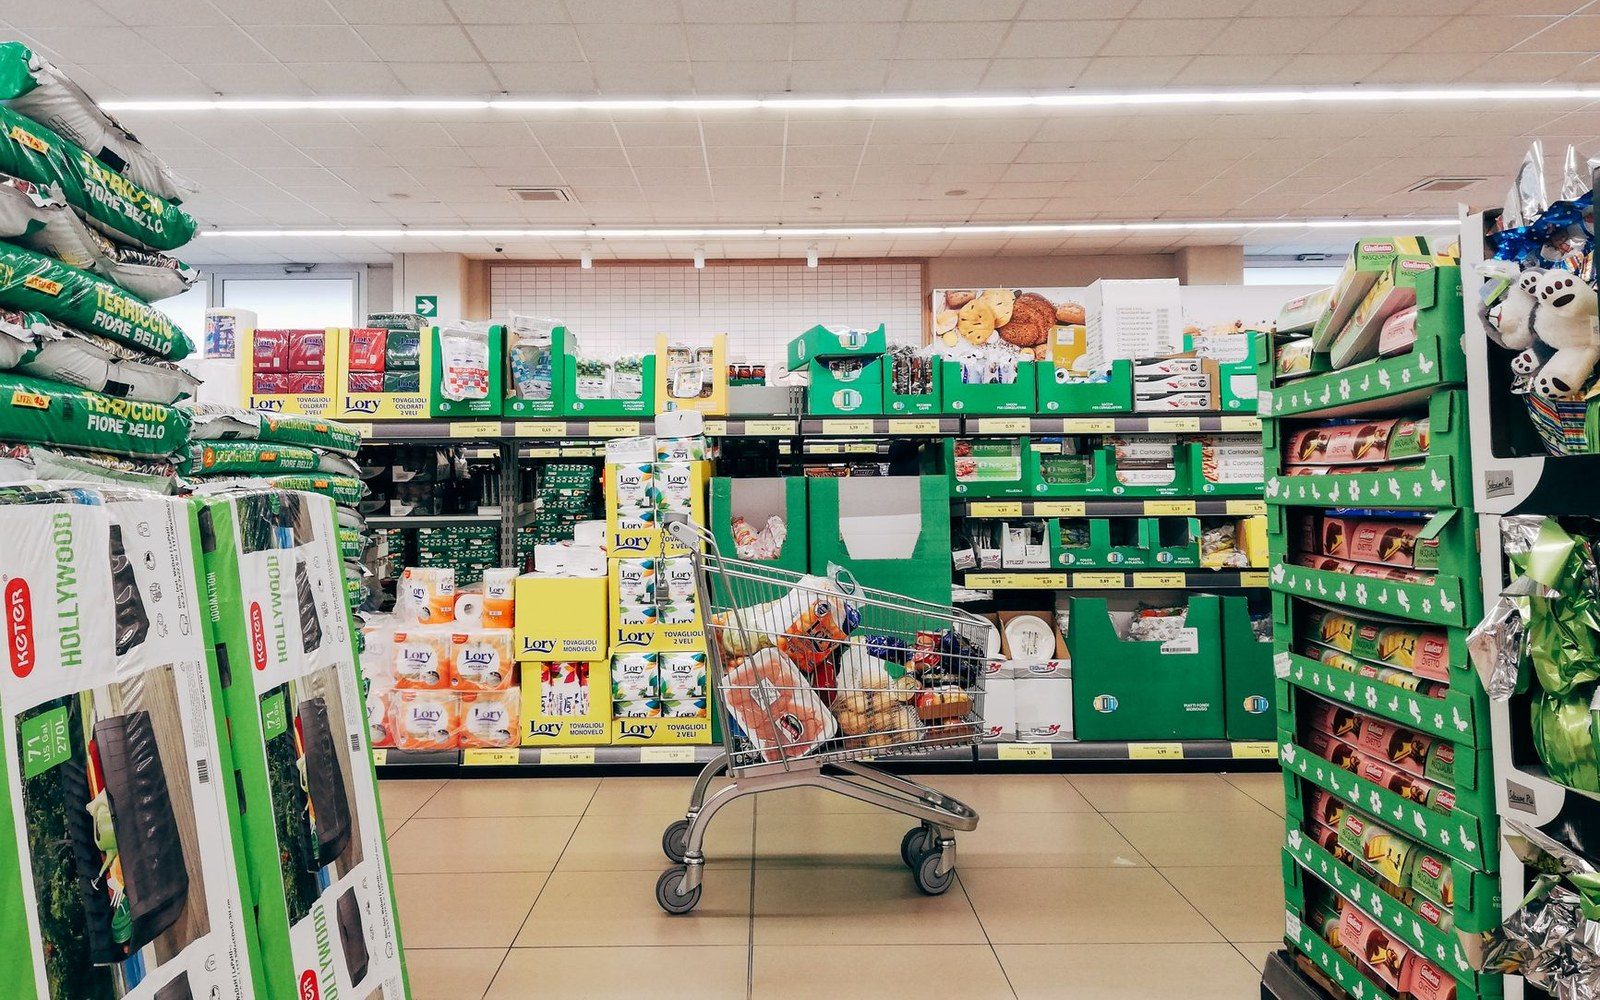
A single item on a conveyor belt is almost meaningless. A basket is a biography.
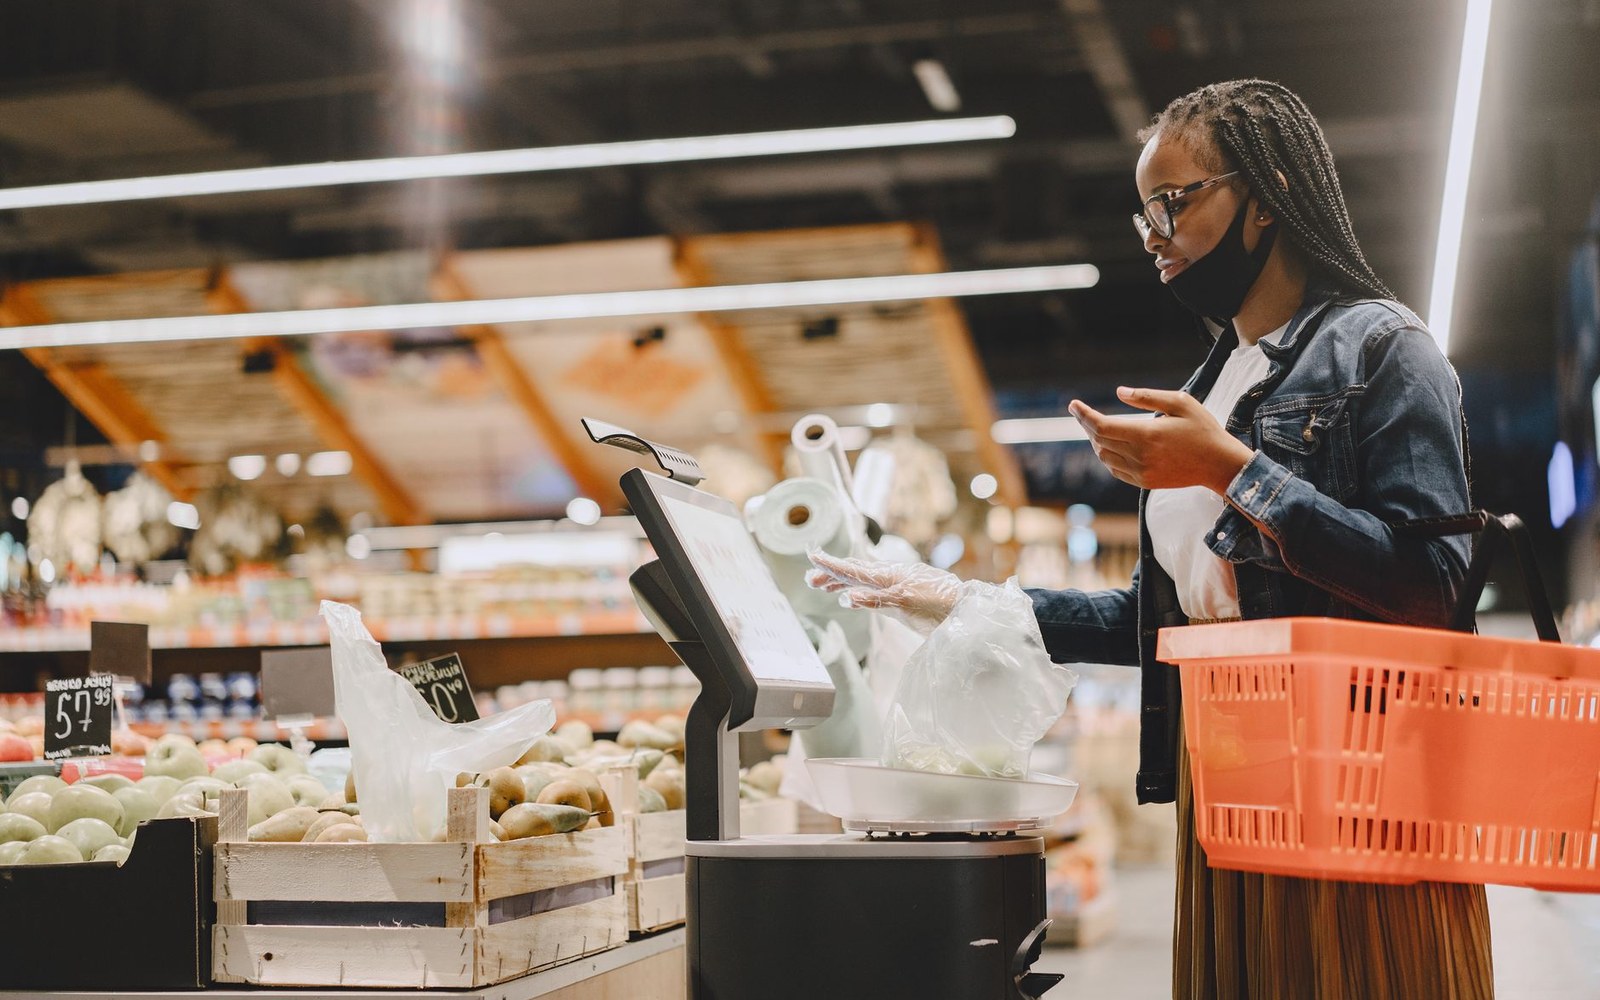
Sequence, frequency and combination say more than any one item does.
Fig. 2 · Photo: Gustavo Fring / Pexels
When a loyalty card is scanned or an account is logged in at checkout, what transfers to the retailer's systems is not just a list of products — it is a sequence, a timestamp, a frequency pattern and a set of combinations. The nappy bought alongside the craft beer. The ready meal on a Wednesday evening. The branded painkiller in a basket that, until that week, had only ever held own-label. Each of those combinations carries signal, and people whose job it is to read that signal have been doing so, at scale, since the mid-1990s.
The canonical example in retail analytics is the finding — associated with large-format grocery data mining from the 1990s — that nappies and beer appeared together in evening baskets with a frequency that was not random. The pattern held because the person buying the nappies was typically also the household member who happened to be doing that particular shop. The finding, often dramatised beyond what the data actually showed, became shorthand for a real phenomenon: that combination is inference. A retailer who sees two apparently unrelated products in the same basket, repeatedly, across thousands of transactions, is looking at an unmapped household need — which is something worth knowing.
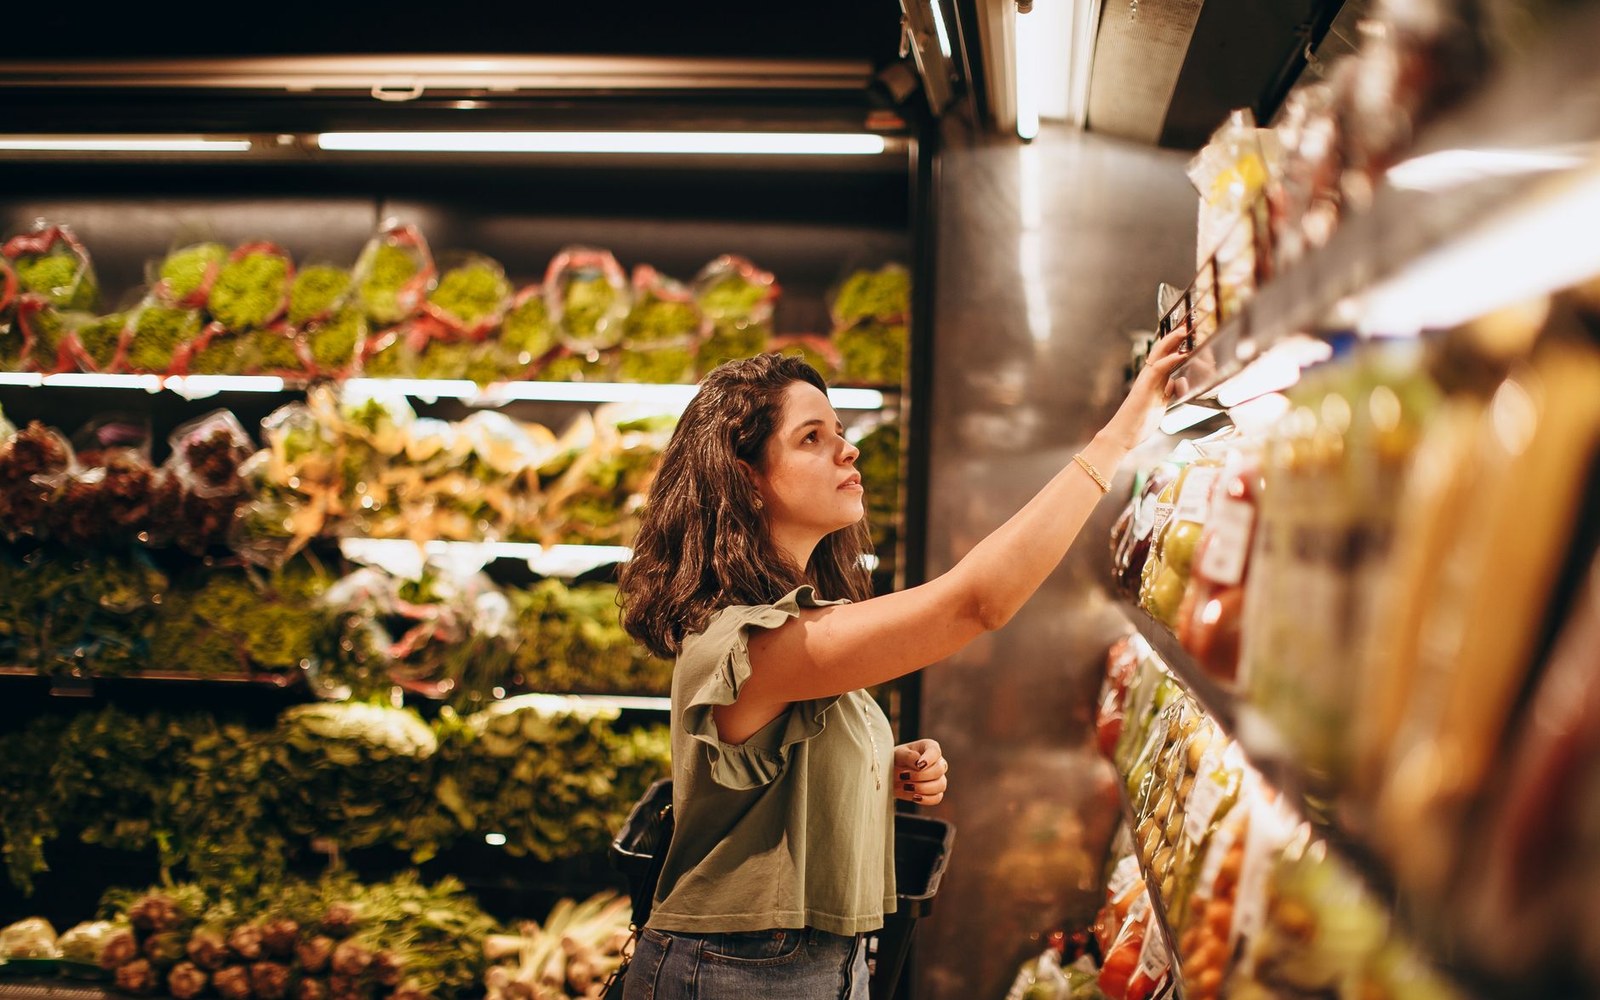
A shelf decision becomes a data point at the till, not in the aisle.
Fig. 3 · Photo: Helena Lopes / Pexels
02Sequence, frequency and the moment that changes everything
Combination is only one dimension. Sequence — what comes before, what comes after, across multiple visits — is where the richer picture emerges. A shopper who suddenly adds a pregnancy test to a long-established basket pattern has, in the language of database marketing, become a different customer. Retailers and their data partners have known for decades that household composition shifts are some of the most commercially significant moments in a customer's life, because they reset almost every buying category at once: food, cleaning, storage, personal care, eventually clothing and beyond.
Each of those combinations carries signal, and people whose job it is to read that signal have been doing so, at scale, since the mid-1990s.
Frequency matters in a different way. A gap where there was none — a loyal weekly shopper who stops appearing for three weeks — is not neutral data. It suggests the shopper has gone elsewhere, or that something in the store has lost them. The absence of a purchase is a purchase, in the sense that it is information. Retention modelling, now standard across most large grocery and general merchandise retailers, uses these gaps as trigger points.
The basket's timing dimension runs deeper still. A transaction at eleven on a Tuesday morning belongs to a different shopper context than one at six on a Friday evening. The same person buying the same items in those two windows may be on entirely different household missions — top-up versus the main weekly shop — and the retailer's systems are designed to distinguish them. Mission classification is the term of art: bulk stock-up, convenience grab, occasion-driven, routine replenishment. Each mission shapes which promotions are relevant, which category adjacencies make sense, and which parts of the digital or physical store to surface next time.
03What the record is built to do
Understanding what loyalty data is — and what it is designed to produce — matters more than whether any single basket feels revealing. The record accumulated across dozens of visits, cross-referenced with postcode data, panel data and increasingly with online browsing behaviour where the same account spans both channels, is what makes the personalised offer possible. The discount feels bespoke because it is built from a profile that genuinely is. That profile was assembled basket by basket.
Retailers also sell aggregated and anonymised versions of this data to their supplier brands, who are trying to understand not just whether their product is bought but what it is bought with, what it replaces and who is buying it. This is the retail media and insight business that has grown sharply in the past decade — separate revenue, separate teams, enabled entirely by the granularity of basket-level records.
None of this is hidden, in the sense that the data collection is disclosed in terms and conditions. It is simply not foregrounded. The loyalty card is presented as a discount mechanism; loyalty is a data programme, and the basket is its raw material. Sequence, frequency and combination are being read every time a shopper reaches the end of a journey through the store. The cart is emptied. The record is not.
This page describes a retail technique and where it came from. It contains no guidance about money, no products and no offers.
Next · 05 Record
The personalised offer →